What the questions look like
Most of these questions show a scatterplot, with one dot for each pair of measurements and often a line of best fit drawn through them. Others give a curve, a table, or a short story with no graph.
Read the last line first. It might say:
- “Which of the following is closest to the How steep a line is, measured by how much it goes up for each unit it moves to the right.Read the lesson of the line of best fit?”
- “Which of the following is the best interpretation of the slope of the line of best fit in this context?”
- “How many of the data points lie above the line of best fit?”
- “Which of the following Two expressions set equal to each other, like 5x + 7 = 22.Read the lesson is the most appropriate A relationship where each step multiplies by the same number, like doubling every year.Read the lesson model for the data shown in the scatterplot?”
- “What type of A rule that takes in one number and gives back one number, like f(x) = 5x - 7.Read the lesson best models the relationship?”
There's no way to type a picture's dots into Desmos, so it helps only with a table, or to check a model against two points.
Read the axes first
Before you read a number off a graph, read both One of the two lines a graph is measured against, one running across and one running up. labels so you know what each one measures and in what unit. Then check what a square is worth.
Count squares in the axis's own steps. A square can be worth 2, 5, 0.5 or anything else, so read the numbered gridlines before you count.
- Right
- With gridlines every 5, a dot two squares above the 20 line is at 30.
- Wrong
- With gridlines every 5, a dot two squares above the 20 line is at 22.
22 counts each square as 1. Here each square is 5, so two squares is 10.
An axis might also start above 0, so the bottom edge of the graph isn't 0. And the label might say “in hundreds of liters.” Then a reading of 3 means 300 liters, and a question about a 600-liter tank sends you to 6 on that axis.
A dot or the line
At a charity walk, each walker's dot shows how many laps they walked and how much money they raised. Each square across is 1 lap, and each square up is $4.
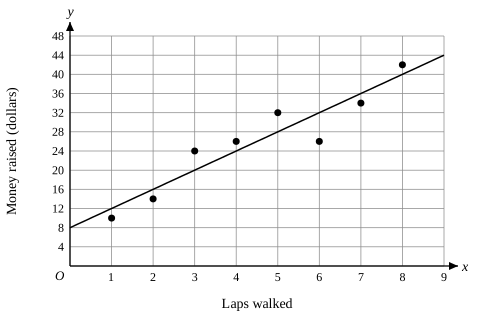
Find 3 laps on the horizontal axis. The dot above it is at $24, and the line passes through $20 there.
A recorded or actual value comes from a dot. A predicted value comes from the line.
- Right
- The walker who walked 3 laps raised $24.
- Wrong
- The walker who walked 3 laps raised $20.
$20 is what the line predicts for 3 laps. The dot is what that walker raised.
Trap: The dot where the line belongs
Asked how much the 3-lap walker raised, one choice is 20, the height of the line. Another is 3, the number of laps.
What to do: Find predicted, recorded or actual in the question first. Then put your finger on the dot or the line at the given and read across.
Some questions ask how many dots sit above or below the line. Go left to right and compare each dot with the line directly above or below it. On the walk's plot, 4 dots are above the line and 4 are below. The dots at 4 and 8 laps sit only half a square above it, so look closely there. A dot right on the line counts as neither.
Here's one where the scale matters.
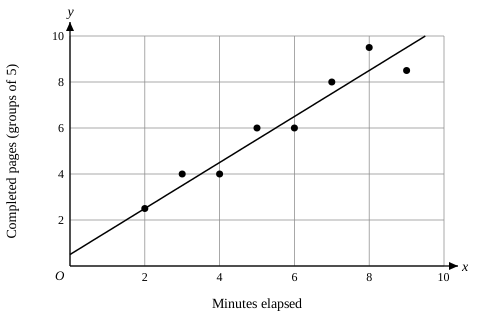
The scatterplot shows completed pages during Layla’s print run and a line of best fit.
How many pages had been completed after minutes?
- A
- B
- C
- D
Show the answer
- A
This reads the line’s predicted value of groups at minutes instead of the observed dot. Converting that prediction gives pages.
- BCorrect answer
At minutes, the observed dot is at groups of pages. Therefore, pages had been completed.
- C
This reports the observed dot’s horizontal coordinate, , instead of reading its vertical coordinate of groups.
- D
This reads groups from the neighboring point at minutes. It also treats each vertical-axis unit as page even though each unit represents pages.
Solution
Find the observed dot whose horizontal coordinate is minutes. Its vertical coordinate is , so Layla completed groups of pages.
Each group contains pages, so . After minutes, pages had been completed.
How far a dot is from the line
On the walk's plot, the 3-lap walker raised $24 and the line predicted $20. “How much more than predicted” means the actual value minus the predicted one. This difference is called the The actual value minus the value the line of best fit predicts, so a point above the line gives a positive number..
Subtract the prediction from the actual value. A dot above the line gives a positive number, and a dot below gives a negative one.
- Right
- The 3-lap walker raised dollars more than predicted.
- Wrong
- The 3-lap walker raised dollars more than predicted.
Subtracting in the other order flips the sign. The dot is above the line, so the answer has to be positive.
A question might ask where the line predicts more than was recorded. That's every dot below the line.
Slope of the line of best fit
You find the slope the same way as in linear functions. On a scatterplot, the work is in picking two points the line itself crosses at gridlines. On the walk's plot, the line meets the vertical axis at $8 and passes through the corner where 5 laps meets $28.
Two places the line crosses gridlines.
Change in dollars over change in laps.
Divide. The line rises $4 a lap.
Put the change in the vertical quantity on top.
- Right
- Wrong
0.25 is laps per dollar. The slope here is dollars per lap, so the change in dollars goes on top.
Trap: Slope from two dots
A choice of 5.5 comes from two dots, and , which give . Dots scatter around the line, so they give a different slope.
What to do: Read both points off the line itself, even when a dot is easier to see.
The line won't always reach the vertical axis. Say it crosses gridlines only at and . Those two points give the slope, and walking back to gives the The output when the input is 0, which is where a graph crosses the vertical axis.Read the lesson.
Change in over change in .
Divide.
From , go 2 units left to . The line drops 2.5 for each unit left.
Write the equation.
The walk's line climbs about $4 a lap, which is enough to pick 4 from 0.25, 4, 8 and .
- Do this
- Get a rough slope from the graph and pick the choice it matches.
- Not this
- Keep hunting for exact crossings once a rough reading has ruled out three choices.
On a “closest to” question the choices sit far apart.
What the slope and starting value mean
The walk's slope is 4, in dollars per lap. To say what it means, put both quantities in the sentence.
The slope is how much the predicted vertical quantity changes for each additional unit of the horizontal quantity.
- Right
- The predicted amount raised increases by $4 for each additional lap.
- Wrong
- The predicted number of laps increases by 4 for each additional dollar raised.
The wrong sentence swaps the two quantities. The slope is $4 per lap, so it's the money that changes with each extra lap.
Trap: The slope with the wrong sign
“The predicted amount raised decreases by $4 for each additional lap” has the right number and the wrong direction. The walk's line rises.
What to do: Check whether the line rises or falls from left to right, and make the sentence say increases or decreases to match.
A line of best fit for pizza prices at several shops is , where is the number of toppings and is the price in dollars.
The number multiplying is the change for each additional unit. The number standing alone is the starting value, the predicted when .
- Right
- The line predicts a price of $13 for a pizza with no toppings.
- Wrong
- The line predicts the price goes up $13 for each additional topping.
The 2 multiplies , so it's the change per topping. The 13 stands alone, so it's the price when .
If none of the pizzas in the data were plain, 13 is only where the line lands when you follow it back to . It still means the predicted price of a plain pizza, so pick the choice that calls it predicted or estimated.
Here's one with a falling line.
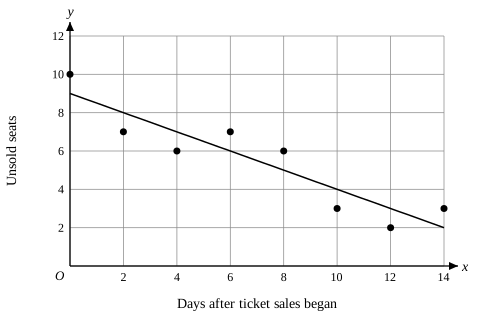
Farid tracks unsold bus-tour seats after ticket sales begin.
Which of the following is the best interpretation of the slope of the line of best fit in this context?
- A
The predicted number of days after ticket sales begin decreases by for each additional unsold seat.
- B
The predicted number of unsold seats decreases by for each additional day after ticket sales begin.
- C
The predicted number of unsold seats increases by for each additional day after ticket sales begin.
- D
The predicted number of unsold seats decreases by for each additional day after ticket sales begin.
Show the answer
- A
The predicted number of days after ticket sales begin decreases by for each additional unsold seat.
This interpretation exchanges the The number you put into a function, like the 4 in f(4).Read the lesson and The number a function gives back, like the 13 when f(4) = 13.Read the lesson quantities. The How steep a line is, measured by how much it goes up for each unit it moves to the right.Read the lesson describes predicted unsold seats per additional day, not predicted days per additional unsold seat.
- B
The predicted number of unsold seats decreases by for each additional day after ticket sales begin.
Correct answerUsing two points on the The straight line that best follows the trend of the dots in a scatterplot.Read the lesson, the How steep a line is, measured by how much it goes up for each unit it moves to the right.Read the lesson is . Therefore, the predicted number of unsold seats decreases by for each additional day after ticket sales begin.
- C
The predicted number of unsold seats increases by for each additional day after ticket sales begin.
This interpretation flips the sign of the How steep a line is, measured by how much it goes up for each unit it moves to the right.Read the lesson. Because the line falls from left to right, its slope is negative, so the predicted number of unsold seats decreases.
- D
The predicted number of unsold seats decreases by for each additional day after ticket sales begin.
This uses the -intercept, , as the per-day How much the output changes each time the input goes up by 1.Read the lesson. The Where a graph crosses an axis.Read the lesson is the predicted number of unsold seats when ticket sales begin, while the How steep a line is, measured by how much it goes up for each unit it moves to the right.Read the lesson is seat per day.
Solution
Choose two points on the The straight line that best follows the trend of the dots in a scatterplot.Read the lesson, such as and . Compute the How steep a line is, measured by how much it goes up for each unit it moves to the right.Read the lesson:
.
The horizontal quantity is days after ticket sales began, and the vertical quantity is unsold seats. A slope of means that for each additional day, the predicted number of unsold seats decreases by .
Average rate of change between two dots
An average How much the output changes each time the input goes up by 1.Read the lesson comes from the two dots the question names. Say a question asks for it from to on the walk's plot, where the 2-lap dot is at $14 and the 6-lap dot is at $26.
Read the two named dots.
Change in dollars over change in laps.
Divide. That's $3 per lap.
Divide the change in by the change in .
- Right
- The average rate of change is dollars per lap.
- Wrong
- The average rate of change is 12 dollars per lap.
12 is the change over all 4 laps. Dividing by 4 gives the change for one lap.
The dots in between, 24, 26 and 32, don't change the answer, and neither does the line's slope of 4.
When the later dot is lower, the rate is negative. From $32 at 5 laps to $26 at 6 laps, the rate is dollars per lap. On a A question where you type your own answer instead of picking one of four.Read the lesson, type the minus sign: -6.
Try one where the dots fall.
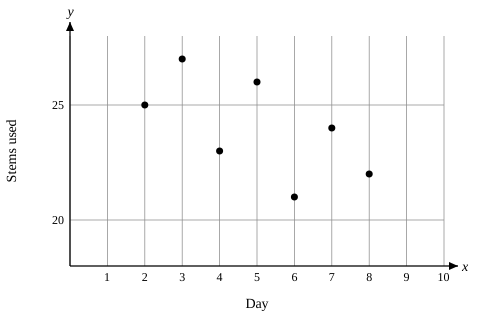
Fabre recorded the number of flower stems used in one display on each of seven days. The scatterplot shows the data.
What was the average rate of change, in stems per day, from day 2 to day 8?
Show the answer
Accepted answers: -1/2, -0.5, -.5
Solution
From day 2 to day 8, the number of stems changes from 25 to 22, so the change is stems over days. The average How much the output changes each time the input goes up by 1.Read the lesson is stem per day.
A response of gives the total change in stems without dividing by the 6 elapsed days. A response of uses the correct magnitude but drops the minus sign that shows the number of stems decreased.
Note that , , and are examples of ways to enter a correct answer.
Linear or exponential
To describe a graph or a list of values, answer two questions separately. Do the values go up or down as goes up? And does each step add the same amount, or multiply by the same number?
Increasing means the values go up as you read left to right. A graph that rises by less and less is still increasing.
- Right
- 40, 60, 70, 75 is increasing.
- Wrong
- 40, 60, 70, 75 is decreasing.
The values rise by 20, then 10, then 5. The rises get smaller, but every value is bigger than the one before.
For the shape, use equally spaced -values and compare each -value with the next.
Values at .
Subtract each value from the next. The differences change, so it isn't linear.
Divide each value by the one before. It's 1.5 every time.
The same difference each step means linear. The same multiplier each step means exponential.
- Right
- 200, 300, 450, 675 fits an exponential model.
- Wrong
- 200, 300, 450, 675 fits a linear model.
The amount added changes from step to step. The multiplier, 1.5, stays the same.
A An expression whose biggest power is a square, like x squared plus 3x minus 4.Read the lesson model turns around. Dots that rise, level off and come back down can't fit a linear or an exponential model, because neither one ever turns. In a table, check the differences of the differences. For 1, 4, 9, 16 the differences are 3, 5, 7, and their differences are 2 and 2. When those match, the model is quadratic.
A story with no graph works the same way. A snowbank that loses 2 inches of depth each day is decreasing linear, because it loses the same amount every day. A used phone that loses 15% of its value each year is decreasing exponential, because it loses the same percent. Doubling and halving are exponential too.
Trap: The wrong family
“Decreasing exponential” for the snowbank is wrong. It loses 2 inches every day, the same amount each time, so the model is linear.
What to do: Ask whether each step adds the same amount or multiplies by the same number. Then decide the direction separately.
The starting value and multiplier
An exponential model is written . is the starting value, the -value at , and is the multiplier for each step of 1 in . Say a falling curve passes through and . Then , and .
Take from the point on the vertical axis.
- Right
- Wrong
45 is the value at . The starting value is the one at .
A above 1 makes the curve grow, and a between 0 and 1 makes it shrink. So can't fit a falling curve.
Trap: A minus sign in the exponent
looks right, but the minus sign in the The small raised number that says how many times to multiply, like the 3 in x cubed.Read the lesson turns decay into growth. At it gives 180 where the curve shows 45.
What to do: Put a second point into the choice and check that it fits.
The two marked points might be more than one step apart, like and .
Divide the two -values. This is the multiplier for 2 steps.
Two steps means multiplying by twice.
Take the square root of the top and of the bottom.
Divide.
Check: two steps from 100 land on 81.
Divide the two -values. For a gap of 2 in , take the square root. For a gap of 3, take the cube root.
- Right
- Through and , .
- Wrong
- Through and , .
0.81 is the multiplier for two steps of . For one step, take its square root.
A table works the same way. If goes 0, 2, 4, 6 and the values go 5, 10, 20, 40, each row doubles over 2 steps of . So , about 1.41, and you can also write the model as .
Check an exponential choice
- Type the choice with
f(x)=in place ofy=, such asf(x)=100(0.9)^x. - On the next two lines, type
f(0)andf(2). Desmos prints each value beside it. - If they aren't 100 and 81, cross that choice out.
When the data come as a table
When the data come as a table, Desmos can find the slope and starting value of a linear model for you.
Fit a line to a table
- Open the plus menu and choose Table.
- Type the -values in the column and the -values in the column.
- On a new line, type
y1~mx1+b. The~needs Shift. - The box under that line shows and .
For an exponential or quadratic choice, use the check in the last section at two of the table's -values. Desmos for data shows more of this.
When every y-value is multiplied
Say a data set has the line of best fit , and a new data set is made by multiplying every -value by 2.5. Every prediction gets 2.5 times bigger, including the one at .
Multiply the whole right side by 2.5.
and .
Trap: Only half the scaling
scales the slope and leaves the 6 alone, so at it still predicts 6 where the new data call for 15.
What to do: Multiply both numbers, then check the prediction at . It should be 2.5 times the old one.
If every -value is doubled instead, each rise takes twice as far across, so the slope is cut in half. becomes . The starting value stays 6, since doubling still gives 0.
If the first line is drawn on a graph, read its slope and starting value, then multiply.
Practice
Before each one, decide whether the question wants a dot, the line, or the pattern in the values. Then check that the sign of your answer matches the direction of the graph.
Next steps
Drills need a free account, which also saves your lesson progress on every device. Sign up free
Related lessons