What the question looks like
You get a short paragraph about a study and four choices. Some questions add a table. The last line asks one of these:
- “Which of the following is the largest population to which the results of the study can be generalized?”
- “Based on the design of the study, what is the largest group to which these results can be applied?”
- “Which of the following is the most appropriate conclusion based on the study?”
For the first two, each choice names a group. For the last one, each choice is a full sentence about what the study found.
There's nothing to calculate, so leave Desmos closed. Even when there's a table, you won't need to add anything in it. If the question gives an estimate with a How far an estimate from a sample could be off, like plus or minus 3%.Read the lesson, you want Inference from sample statistics instead.
Working through a question
A bike-share program has members. Of these, have yearly passes, and of the yearly pass holders live downtown. The program selects of those members at random and asks each one how satisfied they are with the bikes.
Which of the following is the largest population to which the results of the study can be generalized?
- A. All members
- B. The members with yearly passes
- C. The yearly pass holders who live downtown
- D. The members the program selected
- Find “at random” and see what it describes. Here it describes how the program picked people for the study. (When it describes who got which treatment, that's the cause question, further down.)
- Say the whole group they picked from before you look at the choices. The came from “those members,” and those are the yearly pass holders who live downtown. The are the sample, the people the study asked. The are the population, the group the results can describe.
- Match a choice to the group you said, word for word.
- A and B are bigger groups. The other members in them had no chance of being picked, so the sample tells you nothing about them.
- D is the sample itself. Picking at random lets the results reach everyone in the group the sample came from, and the question asks for the largest group.
- C keeps both conditions, a yearly pass and living downtown, so C is correct.
“Largest” means the largest group the study lets you describe. The is the biggest number on the page, but that doesn't make it the answer.
Trap: Reaching too far
B, “The members with yearly passes,” uses a group straight from the paragraph. It just leaves out downtown.
What to do: Read the choice against the group you said in step 2. If it drops a condition, it takes in people who couldn't have been picked.
Trap: Stopping at the sample
D, “The members the program selected,” looks safe because those are the people the study asked.
What to do: In “selects 50 of those 360,” the 50 is the sample and the 360 is the population. Take the 360.
If the paragraph never says the sample was picked at random, as with volunteers or people who chose to send back a survey, the results describe only the people in the study. Measuring them carefully afterward doesn't change that.
Check every detail
A hiking club has members. Of these, have belonged to the club for at least years, and led a hike last year. Omar selects members at random from the who have belonged for at least years, then records their weekly miles for the next months.
What is the largest group to which Omar's results can be applied?
- A. All members of the club
- B. The members who led a hike last year
- C. The members who have belonged to the club for at least years
- D. The members who had belonged to the club for at least years on the day the study started
D is correct. A reaches too far, and the other two each change one detail.
Trap: Same number, different group
B, “The members who led a hike last year,” has the right number, and the group is in the paragraph. But Omar picked from members who had belonged for at least years, and the hike leaders are a different .
What to do: Check each detail of the choice against the sentence with “at random”: the number, the activity, the place and the years.
By the end of the study, every member Omar picked has belonged for at least years, so C can look like an update.
Describe the group as it was when the sample was picked. Ages and years of membership keep growing while a study runs, but that doesn't change the group.
- Right
- The members who had belonged to the club for at least 3 years on the day the study started
- Wrong
- The members who have belonged to the club for at least 4 years
On the day the study started, “at least 4 years” leaves out members who had belonged for 3 to 4 years, and they could have been picked.
Now try one.
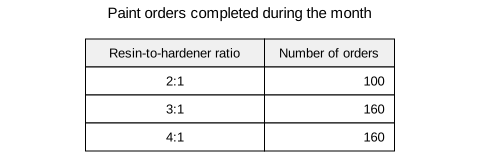
The table summarizes all paint orders received and completed at a shop during one month. Aziz selected at random of the orders received that month that used a resin-to-hardener ratio of . For each selected order, Aziz recorded whether the finished paint met the shop's viscosity standard.
Which of the following is the largest population to which the results of the study can be generalized?
- A
All paint orders received that month
- B
The paint orders Aziz selected
- C
The orders received that month that used a resin-to-hardener ratio of
- D
The orders received that month that used a resin-to-hardener ratio of
Show the answer
- A
All paint orders received that month
This overgeneralizes by dropping the A comparison of two amounts, like 3 to 5.Read the lesson requirement and extending the results to all orders, including orders with other ratios.
- B
The paint orders Aziz selected
This treats the sample of selected orders as the population. Because those orders were randomly selected from the orders with a A comparison of two amounts, like 3 to 5.Read the lesson, the results can be generalized to that larger group.
- C
The orders received that month that used a resin-to-hardener ratio of
This keeps the count of but changes the resin-to-hardener A comparison of two amounts, like 3 to 5.Read the lesson from to . Aziz sampled no orders from the group.
- D
The orders received that month that used a resin-to-hardener ratio of
Correct answerAziz randomly selected the orders from the orders that used a A comparison of two amounts, like 3 to 5.Read the lesson. Random sampling allows the results to be generalized to all orders in that group.
Solution
Identify the population from which the sample was randomly selected. Aziz chose orders at random from the orders that used a resin-to-hardener A comparison of two amounts, like 3 to 5.Read the lesson of . Because the sample was drawn randomly from those orders, the results can be generalized to all orders received that month that used a ratio. The study cannot be generalized to all orders because the sample included only orders with that ratio.
When a table shows only part of the sample
A bus company runs trips a week, and of them are on its express route. A researcher randomly selects of those express trips. The table shows only the selected trips that carried at least riders.
| Day | 25 to 34 riders | 35 or more riders |
|---|---|---|
| Weekday | 8 | 5 |
| Weekend | 7 | 4 |
The researcher picked from the express trips, so they're the population. The table can't change that, and it doesn't matter that it shows fewer trips than were picked. The question asks about the results of the study, and the study measured every trip it picked.
Trap: The table's group
“Express trips that carried at least riders” comes from the sentence about the table and sounds precise. But the rider count was measured after the trips were picked, so it had nothing to do with which ones could be picked. “All trips that carried at least riders” is wrong too, and it also takes in other routes nobody picked from.
What to do: Cover the table and go back to the sentence with “at random.” The group named there is the answer.
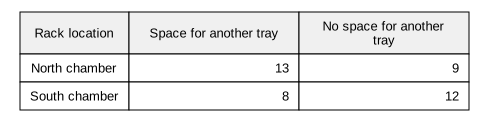
Nilsen’s fish smokehouse uses 144 drying racks, some removable and some fixed in place. Bianca randomly selected 64 racks from the 96 removable drying racks at Nilsen’s fish smokehouse.
During one morning’s inspection, she recorded each selected rack’s location, the number of trays of fish it held, and whether it had enough unused space for another standard tray. Every selected rack was inspected. The table reports results only for the 42 selected racks holding at least 6 trays of fish. Of the other 22 selected racks, 10 had enough unused space for another standard tray and 12 did not.
Which of the following is the largest population to which the proportion of all 64 selected racks with space for another standard tray can be generalized?
- A
The 42 inspected racks holding at least 6 trays of fish
- B
The 96 removable drying racks at Nilsen’s fish smokehouse
- C
All 144 drying racks used at Nilsen’s fish smokehouse during inspection
- D
The 64 drying racks randomly selected for inspection at Nilsen’s smokehouse
Show the answer
- A
The 42 inspected racks holding at least 6 trays of fish
The table’s racks are a subset of the selected racks; the Two ratios set equal to each other, which you can solve for a missing number.Read the lesson in the question also includes the results for the other selected racks.
- B
The 96 removable drying racks at Nilsen’s fish smokehouse
Correct answerBianca randomly selected the racks used to find the Two ratios set equal to each other, which you can solve for a missing number.Read the lesson from the removable drying racks at Nilsen’s fish smokehouse. Random sampling supports generalizing the proportion to that population.
- C
All 144 drying racks used at Nilsen’s fish smokehouse during inspection
This extends the results to fixed racks, which had no chance of being selected. The sampling pool included only removable racks.
- D
The 64 drying racks randomly selected for inspection at Nilsen’s smokehouse
This limits the results to the racks in the inspected sample. Because those racks were randomly selected, the results can be generalized to the population of removable racks from which they were drawn.
Solution
Bianca randomly selected racks from the smokehouse’s removable racks, so those racks form the population the sample can represent.
The table shows that of the selected racks holding at least trays had space for another tray. The passage reports that of the other selected racks did too. Together, these results give a Two ratios set equal to each other, which you can solve for a missing number.Read the lesson of for all selected racks. Fixed racks were excluded from selection, so the largest population to which this proportion can be generalized is the removable drying racks at Nilsen’s fish smokehouse.
Can the study show cause?
Some studies just watch what people already do. Others give each person a treatment, which is whatever the researchers decide for that person, such as a desk type or a study method. Only the second kind can show cause, and only if the researchers decided at random who got what.
An office asks for volunteers and gets . A researcher randomly assigns of them to standing desks and to seated desks. After weeks, the standing-desk group reports less back pain.
Because chance decided who got which desk, the two groups should be about the same in every other way, such as age and how much they exercise. That leaves the desk to explain the difference.
Letting chance decide which treatment each person in a study gets. lets you say cause. Whom the results describe still depends on how people got into the study.
- Right
- Among these 40 volunteers, standing desks led to less back pain.
- Wrong
- Among all office workers, standing desks lead to less back pain.
“At random” describes who got which desk. The 40 chose to volunteer, so nothing says they're like office workers in general.
Now a study that only watches.
A researcher randomly selects of the workers at one company. Workers who already use standing desks report less back pain than workers who use seated desks.
Here the workers picked their own desks. The ones who chose standing desks may also exercise more, and that could explain the difference. Or it could run the other way, if people with less back pain find standing more comfortable. So the most you can say is that the two things are associated: “At this company, using a standing desk is associated with less back pain.” “Tends to” works too.
Trap: Cause from a study that only watched
“At this company, standing desks reduce back pain” fits the numbers. But “reduce” says the desks did it, and these workers chose their own desks.
What to do: Before you accept “causes,” “reduces,” “improves” or “leads to,” find the sentence where the researchers assigned the treatment at random. If there isn't one, cross the choice off.
Checking a conclusion
Random sampling and random assignment do separate jobs, and a study can have any mix of the two.
| How the study was run | Who the results describe | Can it show cause? |
|---|---|---|
| Random sample and random assignment | The whole group sampled from | Yes |
| Random sample only | The whole group sampled from | No, only an association |
| Random assignment only | Only the people studied | Yes, for those people |
| Neither | Only the people studied | No, only an association |
A researcher randomly selects of the students at one high school. She records how many hours each one sleeps on school nights and each one's average on first-period quizzes. Students who slept more tended to have higher quiz averages. Nobody was told how much to sleep.
Which of the following is the most appropriate conclusion based on the study?
- A. At this school, sleeping more causes higher quiz averages.
- B. Among all high school students in the state, sleeping more is associated with higher quiz averages.
- C. At this school, sleeping more is associated with higher grades in every class.
- D. At this school, sleeping more is associated with higher first-period quiz averages.
Check the verb first, then the group, then what was measured.
- A says “causes,” but nobody was assigned an amount of sleep.
- B names every high school in the state, and the sample came from one school.
- C covers every class, and the study measured only first-period quizzes.
- D passes all three checks.
B and C both say “associated with” and are still wrong, so the right verb isn't enough on its own. Watch for the opposite mistake too. A choice saying the results apply only to the students, because nothing was assigned, mixes up the two jobs. Not assigning rules out cause, and the random sample still lets the results reach all students.
Moreau sawmill sells planks of several wood species. To investigate how plank length relates to sale price, Adisa randomly selected 64 planks from all oak planks sold by Moreau sawmill during April. For each selected plank, Adisa recorded its length and its sale price from the mill’s sales records. Longer planks tended to have higher sale prices. The records reflected ordinary sales; Adisa did not determine the planks’ dimensions or influence their prices. Production costs were not recorded.
Which of the following is the most appropriate conclusion based on the study?
- A
Among oak planks sold by Moreau sawmill during April, increased plank length causes higher sale prices.
- B
Among all planks sold by Moreau sawmill during April, increased plank length is associated with higher sale prices.
- C
Among oak planks sold by Moreau sawmill during April, increased plank length is associated with higher sale prices.
- D
Among oak planks sold by Moreau sawmill during April, increased plank length is associated with higher profits.
Show the answer
- A
Among oak planks sold by Moreau sawmill during April, increased plank length causes higher sale prices.
This treats the observed association as cause and effect. Adisa recorded ordinary sales without randomly assigning plank lengths, so the study cannot establish that greater length causes a higher sale price.
- B
Among all planks sold by Moreau sawmill during April, increased plank length is associated with higher sale prices.
This extends the association to every wood species sold by the mill. The random sample included only oak planks, so it does not support a conclusion about all planks.
- C
Among oak planks sold by Moreau sawmill during April, increased plank length is associated with higher sale prices.
Correct answerThe random sample supports generalizing the observed relationship to oak planks sold by Moreau sawmill during April. Longer planks tended to have higher sale prices, and recording ordinary sales without assigning plank lengths supports an association.
- D
Among oak planks sold by Moreau sawmill during April, increased plank length is associated with higher profits.
This substitutes profit for the measured sale price. Profit depends on costs as well as sale price, and production costs were not recorded.
Solution
Adisa randomly selected planks from all oak planks sold by Moreau sawmill during April. That sampling method supports a conclusion about that population.
The recorded measurements were length and sale price, and longer planks tended to have higher sale prices. Adisa did not assign plank lengths or influence prices, so the study supports an association, not a causal claim.
The supported conclusion is that increased plank length is associated with higher sale prices among oak planks sold by Moreau sawmill during April. The sample does not support extending the conclusion to other wood species, and the missing cost data prevent a conclusion about profits.
Practice
For each question, say the group the sample was picked from, then check whether anyone was assigned a treatment at random.
Next steps
Drills need a free account, which also saves your lesson progress on every device. Sign up free
Related lessons