What the questions look like
Each question is about one batch of numbers, given as a list, a table, a bar graph, a dot plot, a A bar chart that shows how many values fall in each range. or a box plot. The last line usually reads like one of these:
- “What is the mean of the data shown?”
- “The frequency table summarizes the data values in a data set. What is the maximum data value in the data set?”
- “Which of the following correctly compares the medians and the ranges?”
- “Which of the following lists represents a data set with the smallest How spread out a set of numbers is around its average.?”
Others give the mean and ask for a missing value.
Mean, median, mode and range
Here's what each word means, worked on the list .
Mean: add every value.
Then divide by how many values there are.
Median: the middle value once the list is in order.
Mode: the value that shows up most often.
Range: the largest value minus the smallest.
The mean is the total divided by how many values there are. Every repeat counts.
- Right
- For 2, 3, 3, 4, 13, the mean is 25 ÷ 5 = 5.
- Wrong
- For 2, 3, 3, 4, 13, the mean is 3.
3 is the middle value, so it's the median. The mean uses the total of all five values.
With an even count, the median is halfway between the two middle values. Find the median of .
Sort from least to greatest.
Six values, so average the 3rd and 4th.
Trap: The middle of the printed list
33 is a choice because 26 and 40 sit in the middle of the list as printed, and their average is 33.
What to do: Sort first, every time, even when the list looks nearly in order.
Dot plots and bar graphs
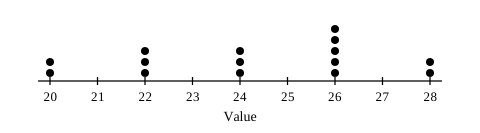
Each dot is one value. The numbers along the bottom are the values, and a stack's height is how many times that value appears.
Count the values: add the stack heights.
With 15 values, the median is the 8th.
Count up from the left to the 8th place. The median is 24.
Range: largest value minus smallest.
Mode: the value under the tallest stack.
The mode, range, maximum and minimum all come from the values along the bottom.
- Right
- For this dot plot, the range is 28 − 20 = 8.
- Wrong
- For this dot plot, the range is 5, the height of the tallest stack.
A stack's height is a count. The range is measured along the bottom.
A bar graph of frequencies reads the same way.
Frequency tables
A frequency table lists each value once, with how many times it appears.
| Value | Frequency |
|---|---|
| 12 | 3 |
| 14 | 5 |
| 16 | 2 |
| 18 | 4 |
| 20 | 0 |
The maximum is the largest value with a frequency above 0.
- Right
- The maximum data value is 18.
- Wrong
- The maximum data value is 20.
A frequency of 0 means no value of 20 was recorded.
Trap: A count where a value belongs
5 is a choice because it's the biggest frequency, and 14 because it's the most common value.
What to do: Before you read a number off a table or graph, say which column or axis holds the values and which holds the counts.
For a mean, each value counts as many times as it appears. Multiply each value by its frequency and add to get the total. Then divide by the total of the frequencies. A common wrong choice divides by the number of rows instead.
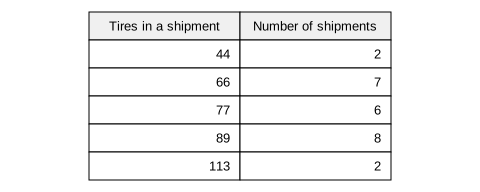
Ilona recorded the bike shop’s tire shipments.
What is the mean number of tires per shipment?
Show the answer
Accepted answer: 78
Solution
Multiply each tire count by its number of shipments, then add: . The total number of shipments is , so the mean is .
A common wrong answer is , which results from dividing by the 5 table rows instead of the 25 shipments. Another common wrong answer is , which is the The middle value once the numbers are put in order.Read the lesson of the expanded 25-value data set, not the mean.
For a median, count up through the frequencies. Take values 20, 25 and 30 with frequencies 7, 4 and 2.
Count the values.
With 13 values, the median is the 7th.
The 20s fill places 1 to 7, so the median is 20, even though 25 is the middle row.
Some questions make a frequency the unknown. With frequencies 7, 4 and , what's the smallest that makes the median 30?
The 30s start at place 12, so the middle has to be place 12 or later.
The median averages places 11 and 12, a 25 and a 30. That's 27.5.
The median is place 12, a 30. So the smallest is 12.
Combining two groups
Group A has 12 values with a mean of 70. Group B has 3 values with a mean of 90. What's the mean of all 15?
Group A's total: mean times count.
Group B's total.
Add the totals and divide by all 15 values.
Average the two means only when the groups are the same size.
- Right
- The mean of all 15 values is 74.
- Wrong
- The mean of all 15 values is (70 + 90) ÷ 2 = 80.
Averaging the two means counts 3 values as much as 12.
The answer lands between the two means, closer to the mean of the group with more values.
Combined mean
Here and are the group sizes, and and are their means.
Histograms
A histogram is a bar graph where each bar covers an interval of values, like 100 to 120. A bar's height is how many values fall in that interval.
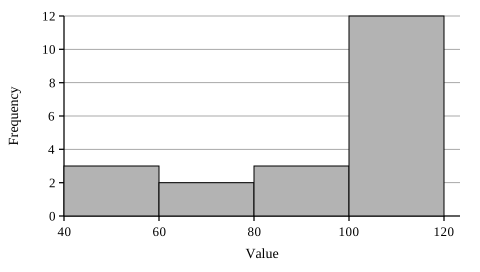
Count the values: add the bar heights.
With 20 values, the median averages these two.
The first three bars hold only 8 values, so both middle places are in the last bar.
A histogram tells you which interval holds the median. It can't give an exact mean, median or range.
- Right
- The median is somewhere from 100 to 120.
- Wrong
- The median is 110.
110 is the middle of the interval. The histogram doesn't say any value equals 110.
Box plots
A box plot shows five numbers: the minimum, the first The value a quarter of the way through sorted data, or three quarters of the way through. The box in a box plot runs between those two values. , the median, the third quartile , and the maximum. is the middle of the lower half of the sorted data, and is the middle of the upper half.
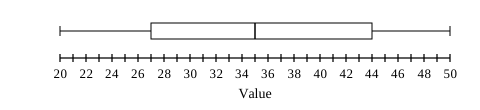
The The spread of the middle half of the data, found by subtracting the lower quartile from the upper quartile., or IQR, is the width of the box.
Range: one whisker end to the other.
IQR: .
A box plot gives no mean and no count of values.
- Right
- For this box plot, the median is 35.
- Wrong
- For this box plot, the mean is 35.
The line inside the box marks the median.
Trap: A mean read from a box plot
With two box plots side by side, a choice says the group with the higher median line also has the higher mean. The plots show medians only.
What to do: Find the mark that proves the statement. If there isn't one, the choice can't be supported.
“There is not enough information” is right only when the display lacks what you need, like a mean from a box plot. It's never right when the full lists are printed.
Comparing standard deviations
Standard deviation measures how far the values usually sit from their mean. On the test you only compare them. These two lists both have a mean of 5 and a range of 10.
Distances from 5: 5, 0, 0, 5.
Distances from 5: 5, 5, 5, 5.
The more the values bunch up near the mean, the smaller the standard deviation.
- Right
- 0, 5, 5, 10 has a smaller standard deviation than 0, 0, 10, 10.
- Wrong
- 0, 5, 5, 10 has the same standard deviation as 0, 0, 10, 10.
Two values in the first list sit right on the mean. Range uses only the two ends.
Trap: Spread judged from the ends
When four lists all run from 0 to 10, a list like 0, 1, 1, 9, 9, 10 looks no wider than the others, but every value sits at least 4 from its mean of 5.
What to do: Find each list's center, then ask which one has more values far from it.
If a question prints one histogram and describes another in words, sketch the second beside the first. The one with more values in the middle bars has the smaller standard deviation.
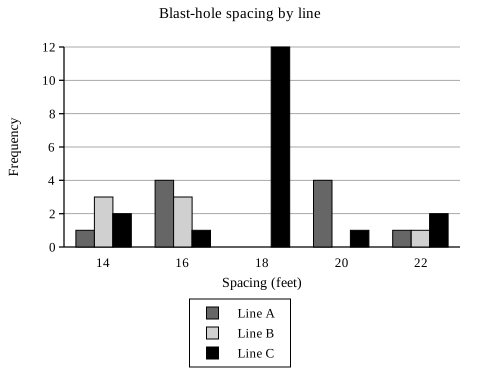
At Iker's quarry, the graph gives blast-hole spacings for lines A, B, and C. Line D's spacings are 14 and 22 feet.
Which line has the smallest standard deviation in spacing?
- A
Line A
- B
Line B
- C
Line C
- D
Line D
Show the answer
- A
Line A
This choice judges spread from the endpoint frequencies while overlooking the four spacings at both 16 and 20 feet. All four lines have the same range, and Line A has substantial frequency away from its mean.
- B
Line B
This choice uses Line B's smaller The middle value once the numbers are put in order.Read the lesson as evidence of a smaller How spread out a set of numbers is around its average.Read the lesson. The median describes the center, so a smaller median does not mean the data are less spread out.
- C
Line C
Correct answerLine C is centered at 18 feet, and 12 of its 18 spacings equal 18. Its variance is , which is smaller than the variances for lines A, B, and D, so it has the smallest How spread out a set of numbers is around its average.Read the lesson.
- D
Line D
This choice treats having only two observations as a guarantee of less spread. The observations 14 and 22 are each 4 feet from their mean, producing a larger How spread out a set of numbers is around its average.Read the lesson than Line C's.
Solution
Compute each line's variance, since the line with the smallest variance also has the smallest How spread out a set of numbers is around its average.Read the lesson.
Line A is symmetric about 18, so its mean is 18. Its squared deviations from the mean sum to , and there are 10 values, so its variance is .
Line B has mean . Its squared deviations sum to , and there are 7 values, so its variance is .
Line C is symmetric about 18, so its mean is 18. Its squared deviations sum to , and there are 18 values, so its variance is .
Line D has mean , and its variance is . Since is the smallest variance, Line C has the smallest standard deviation.
Adding or removing one value
The values have a mean of 33. Add one more value, 9.
Old total: mean times count.
Add the new value.
Divide by the new count, 6.
A new value below the old mean pulls the mean down, and one above it pulls the mean up.
- Right
- The new mean is 174 ÷ 6 = 29.
- Wrong
- The new mean is (33 + 9) ÷ 2 = 21.
The old mean stands for five values. The 9 is one value out of six.
Trap: The old count
34.8 is a choice because it divides 174 by the old count, 5.
What to do: Write the new count beside the new total before you divide.
Mean after adding one value
Here that's .
For the median, the 9 goes first and the old values move up one place.
Six values, so average the 3rd and 4th.
The mean fell 4, but the median went only from 32 to 30. The median moves one place at most, however far away the new value is.
Trap: One far value moves everything equally
A choice says the mean and the median both fell by 4. Another says the mean rose, though 9 is below 33.
What to do: Let the new value set the mean's direction, then find the new middle places for the median.
To remove a value, take it out of the total and divide by one fewer. The middle places shift back by one.
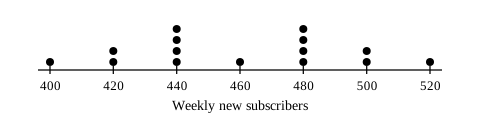
The dot plot summarizes weekly new-subscriber counts for a streaming service over 15 weeks. Data set P consists of these counts. Data set Q contains these same counts plus 1,420 new subscribers recorded during a promotional week.
Which of the following correctly compares the means and the medians of data sets P and Q?
- A
From P to Q, both the mean and the median increase, but the mean increases more.
- B
From P to Q, the mean and the median increase by the same amount.
- C
From P to Q, the mean increases, while the median remains unchanged.
- D
From P to Q, the mean remains unchanged, while the median increases.
Show the answer
- A
From P to Q, both the mean and the median increase, but the mean increases more.
Correct answerThe mean increases from to , a gain of . The The middle value once the numbers are put in order.Read the lesson increases from the eighth value, , to the average of the eighth and ninth values, , a gain of . Both increase, and the mean increases more.
- B
From P to Q, the mean and the median increase by the same amount.
This assumes the high added count increases the The middle value once the numbers are put in order.Read the lesson by the same amount as the mean. The mean increases by , while the change in the middle positions increases the median by only .
- C
From P to Q, the mean increases, while the median remains unchanged.
This assumes an added extreme value cannot change the The middle value once the numbers are put in order.Read the lesson. Adding a sixteenth value makes the median the average of the eighth and ninth values, and , so it rises to .
- D
From P to Q, the mean remains unchanged, while the median increases.
This swaps the roles of the two measures, treating the mean as the one an extreme value cannot move. The added week raises the total to across weeks, so the mean rises from to . That is a larger gain than the The middle value once the numbers are put in order.Read the lesson’s rise from to .
Solution
For data set P, the total is . Its mean is . With values in order, the The middle value once the numbers are put in order.Read the lesson is the eighth value, .
Adding the promotional week gives data set Q a total of across weeks. Its mean is . The added value goes at the end of the ordered list, so the eighth and ninth values remain and . The new median is .
The mean increases by , and the median increases by . Both increase, but the mean increases more.
Some questions describe a set without listing it. Data set M has 40 whole numbers, each between 300 and 400. Data set N is M plus the number 25. Must the mean be less for N? Must the median?
25 is below every value in M, so N's mean must be less.
M's median averages its 20th and 21st values.
N's median is its 21st value. The 25 comes first and pushes M's values up one place, so that's M's 20th.
If M's 20th and 21st values are equal, the medians are equal. Only the mean must be less.
Changing every value
Adding the same number to every value slides the list along. Add 10 to each value in .
Median 5, range 7.
Median 15, range still 7.
Adding to every value adds to the mean, median and mode. The range, IQR and standard deviation stay the same.
- Right
- After 10 is added to every value, the range is still 7.
- Wrong
- After 10 is added to every value, the range is 17.
Both ends moved up 10, so the distance between them didn't change.
Multiplying every value spreads the list out. Multiply each value in by 3.
Median 15, range .
The range tripled too.
Multiplying every value by a positive multiplies the mean, median, range, IQR and standard deviation by .
- Right
- After every value is multiplied by 3, the range is 21.
- Wrong
- After every value is multiplied by 3, the range is still 7.
Multiplying triples every gap between two values.
Trap: A shift mixed up with a stretch
A choice says the range grew after 10 was added to every value, or stayed the same after every value was tripled.
What to do: Check whether the question adds or multiplies, and if you're unsure about the spread, try two numbers.
Some questions add a twist:
- Medians and ranges compared together. Settle the medians first, then the ranges.
- A hidden multiplier. If every value was multiplied by the same number and the mean went from 12 to 48, the number is . A range of 9 becomes 36.
- A correction in words. If every value in a table is 4 less than the real amount, add 4 to every value, or add 4 once to the table's mean.
- Two dot plots with the same shape, one farther along the axis, are a shift, so their standard deviations are equal.
Finding a missing value
Seven values add to 300. With an eighth value, the mean of all eight is 45. What's the eighth?
Total for all eight: mean times count.
Take away the seven you have.
The total is the mean times the count. Subtract the values you know.
- Right
- The total is 45 × 8 = 360, so the eighth value is 60.
- Wrong
- The total is 45 × 7 = 315, so the eighth value is 15.
The mean of 45 is for all eight values.
Eleven values add to 560. A 12th value, a whole number strictly between 60 and 75, makes the mean of all 12 a whole number. What's the 12th value?
Add 60 and 75 to 560.
The total must divide evenly by 12. 612 is too small and 636 too big.
Take away the 11 values you know.
Some questions put letters in the list. is in order from least to greatest, with median 18, range 30 and mean 20. Find and .
The median is the middle value, and is in the middle.
The range is largest minus smallest.
The total is mean times count.
Work out , then subtract .
Add this to . The terms cancel.
Divide by 2, then .
Start with the median, since it hands you a letter for free.
If the letters sit in a frequency table, write the full list with every repeat before you look for the middle place.
When Desmos helps
Desmos helps with a short printed list. In Bluebook the graph is on top and the lines you type on are below it.
Statistics of a short list
- Type
mean([2,3,3,4,13])on a line. It prints 5. - Type
median([2,3,3,4,13])on the next line. It prints 3. - For a frequency table or dot plot, type every repeat, like
30,30,30,30. - To compare spreads, type
stdev([0,5,5,10])andstdev([0,0,10,10])on separate lines and compare the results.
Typing repeats pays for about 20 values or fewer. Skip Desmos for box plots, histograms and sets described in words, and for questions that change every value. The Desmos data and regression lesson goes further.
Practice
If two data sets are compared, say in one line what changed.
Next steps
Drills need a free account, which also saves your lesson progress on every device. Sign up free
Related lessons