What the question looks like
A table, bar graph, or line graph sits above a short passage, and the question is one of these:
- “Which choice most effectively uses data from the table to complete the statement?” You may see “graph” in place of “table,” or “text” or “example” in place of “statement.”
- “Which choice best describes data from the table that support the underlined claim?”
With a blank, the data has to finish the writer's sentence. With an underlined claim, it has to back up those words. Now and then the question asks for data that “weaken” a conclusion instead, so the right choice cuts against it.
There's no calculator in Reading and Writing, and you won't need one. The math is a subtraction or a comparison you can do in your head, so if it seems to need more, reread the sentence.
Working through a question
Average seedling height after 30 days (centimeters)
| Soil | No mulch | Mulch |
|---|---|---|
| Sand | 5 | 12 |
| Sandy loam | 9 | 13 |
| Loam | 15 | 18 |
| Clay | 8 | 8 |
Mulch is a layer of straw or wood chips that keeps soil from drying out. Botanist Amara Okoro grew bean seedlings in four soils, some covered with mulch and some left bare. Sand holds less water than the other three soils, so Okoro expected mulch to help seedlings most in sand. The results support her prediction: ______
Which choice most effectively uses data from the table to complete the statement?
- A. mulched seedlings in loam grew taller (18 centimeters) than mulched seedlings in any other soil.
- B. in sand, mulched seedlings were 7 centimeters taller than unmulched ones, a bigger gain than in any other soil.
- C. in sand, mulched seedlings were 4 centimeters taller than unmulched ones.
- D. seedlings in sand were shorter than seedlings in loam, with or without mulch.
- Read the question, then the passage, and say what the blank needs. Okoro predicted mulch would help most in sand, so the blank has to show that sand gained more from mulch than any other soil. In your own words: “Sand's gain has to be the biggest.”
- Read the labels before the numbers. The title says these are average heights in centimeters, so bigger means taller. On a graph, read the label on each One of the two lines a graph is measured against, one running across and one running up. and every entry in the legend. The passage may also say how to read the numbers.
- Find the numbers you need, and predict when you can. Each soil's gain is the mulch number minus the no-mulch number: 7 for sand, 4 for sandy loam, 3 for loam, 0 for clay. Sand's 7 is the biggest. If the sentence doesn't point to any number, skip the prediction. On a bigger table, ignore every column the sentence doesn't use.
- For each choice, assume its numbers are right and ask whether it does the job.
- A is about the tallest seedlings, but the sentence is about the gain, so A is out.
- D compares soils, and Okoro's point is about mulch, so D is out too.
- B and C both give sand's gain, so both would finish the sentence.
- With two choices left, check their numbers against the row and the column. C says sand gained 4. The sand row reads 5 and 12, a gain of 7. The 4 belongs to sandy loam, one row down. B is the answer.
Reading the sentence
“... since among the sites sampled after the flood, ______”
The words that limit the answer often come last, right before the blank. Here they limit you to the sites sampled after the flood, whatever the first sentence was about. A long setup may also give numbers, or an explanation the passage later drops, and those don't support the blank even when a choice repeats them.
The passage and the table may use different names. If the passage says “young plants” and the column says “under two years,” match them before you compare.
| Soil | No mulch | Mulch |
|---|---|---|
| Sand | 5 | 12 |
| Sandy loam | 9 | 13 |
| Loam | 15 | 18 |
| Clay | 8 | 8 |
Small words change the job. Take “In more than half the soils, mulch added at least 4 centimeters.” Sand added 7 and sandy loam 4, but loam added 3 and clay 0. Two soils out of four is exactly half, so the claim fails.
Keep every limit in the sentence as part of the job.
- Do this
- Hold “more than half” to a majority, “each” to every row, and “only” to no second cause.
- Not this
- Read “the greatest number of” as if it meant “most of.”
The biggest group can still be less than half of the total.
For “each” or “every,” check the rows one at a time. Rows are often in alphabetical or random order, so a pattern you see reading down can hide the one row that breaks it.
Read the word after “greatest” or “most,” too. A question about change needs a starting number as well as an ending one.
Trap: The biggest number on the page
“Mulched seedlings in loam grew taller (18 centimeters) than mulched seedlings in any other soil.” It's true, but a sentence about which soil gained the most needs sand's gain of 7.
What to do: Go back to the row or category the sentence names and read that one.
Comparing the right two things
“To test the mulch itself, Okoro compared seedlings grown in the same soil, with and without mulch.”
| Soil | No mulch | Mulch |
|---|---|---|
| Sand | 5 | 12 |
| Loam | 15 | 18 |
A fair test changes one thing and keeps everything else the same. Here that thing is mulch, so the pair is two cells in one row, like sand without mulch (5) and sand with it (12). Passages call the group that didn't get the treatment, here the bare seedlings, the control group.
Trap: Compared the wrong two things
“Seedlings in sand were shorter than seedlings in loam, with or without mulch.” Both readings are right, but the choice compares soils, and the point is about mulch. A choice that sets this year's mulched seedlings against last year's bare ones fails too, because the year changed along with the mulch.
What to do: Write down the pair you need before you read the choices, then hold each choice to that pair.
What the numbers mean
Read the units with every label. A count, a percent, a time, and a rank each say something different. On a graph, also check what one step on each axis stands for.
Sometimes the rule for reading the display appears only in the passage, often tucked in parentheses or between commas.
“The ages are given in years before present.”
| Layer | Age (years before present) |
|---|---|
| A | 3,200 |
| B | 1,100 |
This scale counts backward from today, so a bigger number is older. Write “bigger = older” next to the table.
Trap: Right reading, backward
“Layer A formed more recently than layer B.” The choice treats the bigger number as the more recent one, the way most scales work, so the order comes out backward.
What to do: Write what a bigger number means next to the display, then say one value as a full sentence: “Layer A formed 3,200 years ago.”
Watch for others like it: a size where smaller means finer, a score where the minus sign matters, or two columns where higher means opposite things. Some tables give correlations, numbers from to that show how closely two things move together. A minus sign means one goes up as the other goes down. The one farther from zero is stronger, so is stronger than .
Percent of what?
Suppose Okoro's results came as percents, with each soil's mulched seedlings shown as a percent of that same soil's bare seedlings.
| Soil | Mulched height as a percent of unmulched |
|---|---|
| Sand | 240 |
| Loam | 120 |
Trap: Right numbers, wrong label
“Mulched seedlings in sand grew taller than mulched seedlings in loam.” Sand's 240 beats loam's 120, but each percent compares a soil with itself. The heights were 12 centimeters in sand and 18 in loam, so loam's were taller.
What to do: Read the whole label, then say one value as a sentence: “Mulched sand seedlings were 240 percent as tall as bare ones.”
The starting value a percent is measured against is the baseline. When each row has its own baseline, the percents show how much each row changed from its own start, and they can't show which one ends higher.
Other labels hide a switch, too. “Production above forecast” counts only the extra, and in a count of plants that died, lower is better.
A count and a share can move in opposite directions. Last year a library made 300 loans, 60 of them audiobooks (20 percent). This year it made 600 loans, 90 of them audiobooks (15 percent).
“The librarian notes that more audiobooks went out this year than last: ______”
A count and a share are different claims. Say which one the sentence needs.
- Right
- audiobook loans rose from 60 to 90.
- Wrong
- audiobook loans fell, from 20 to 15 percent of all loans.
Both are true. The sentence is about how many went out, and only the count says that. Total loans doubled, so the share fell even though the count went up.
Reading the right number
| Soil | No mulch | Mulch |
|---|---|---|
| Sand | 5 | 12 |
| Sandy loam | 9 | 13 |
| Clay | 8 | 8 |
Say the row label and the column header together before you use a number: “sand, mulch, 12.”
Trap: One row off
“Mulched seedlings in sandy loam reached 12 centimeters.” The 12 is in the table, but it's in the sand row, and the two names differ by one word.
What to do: Once two choices are left, check every number in both against its row and column. Slow down where names look alike or neighboring numbers are close.
As a bar graph, these results would be two bars for each soil, one shade for bare soil and one for mulch. Read the legend first, then find the soil, then read the height, because a wrong choice can be an exact reading of the wrong shade. When shades look alike, check the markers or patterns. On a line graph, tell overlapping lines apart at a spot where they're far apart.
Look for cells with no number in them: a blank, a dash, or “below detection limit.” Treat them as unknown, and don't fill in zero. If the clay row had a dash under Mulch, you couldn't check a choice saying mulch did nothing for clay, so it's out.
Check where the vertical axis stops. If it ends at 80, a bar that reaches the top stands for 80. Read heights against the gridlines, and don't take a number printed on the axis as a bar's height unless the bar's top lines up with it.
What the table can't tell you
Average seedling height after 30 days (centimeters)
| Soil | No mulch | Mulch |
|---|---|---|
| Sand | 5 | 12 |
| Clay | 8 | 8 |
Trap: The answer you'd have expected
“Mulched seedlings in clay grew taller than bare ones.” You'd expect mulch to help everywhere, but the clay row reads 8 and 8.
What to do: Point at the cells that make the choice true. If you can't, the reason came from your head.
Trap: Something the table can't show
“Mulch made every seedling in sand grow taller.” The title says these are averages, so the table says nothing about single seedlings. The same goes for a cause (“because mulch keeps sand cool”), a group nobody measured (“all vegetables”), or a soil that isn't in the table.
What to do: Ask what the table would need to show for the choice to be true. If that isn't there, cross the choice off, even if it sounds right.
Choices that are true and still wrong
Okoro expected mulch to help seedlings most in sand. “The results support her prediction: ______”
| Soil | No mulch | Mulch |
|---|---|---|
| Sand | 5 | 12 |
| Sandy loam | 9 | 13 |
| Loam | 15 | 18 |
Trap: True, but it doesn't finish the sentence
“In sandy loam, mulched seedlings were 4 centimeters taller than unmulched ones.” Every number checks out, and it's about mulch, but it says nothing about sand beating the other soils.
What to do: Finish the sentence “If this is true, then ...” and see whether the writer's point comes out the other end.
Each part of a two-part choice has to be true and do the job.
Trap: Goes wrong after “and”
“In sand, mulched seedlings were 7 centimeters taller than unmulched ones, and in loam they were 5 centimeters taller.” It starts exactly like the right answer, but the loam row reads 15 and 18, a gain of 3.
What to do: Read the part after “and,” “but,” or “while” first, then check each part on its own.
Words to know
Passages define their subject words for you, but these words about amounts come up in every topic.
| Word | Plain meaning |
|---|---|
| negligible | Too small to matter |
| attributable | Caused by, or credited to |
| offset | Make up for a loss or effect |
| variability | How much values differ from each other |
| disproportionately | By more or less than its share would suggest |
Practice
Work through the three examples with the five steps, then try five more. For help with the passage around the display, see Reading dense and technical passages. For the same kind of question without a table or graph, see Command of Evidence (Textual).
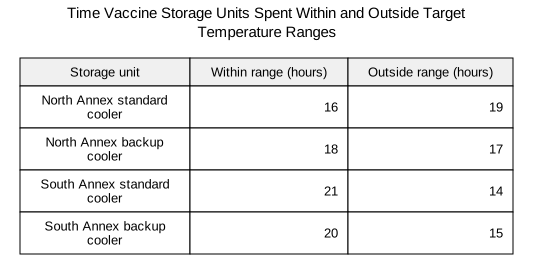
Nadia reviewed how long vaccine storage units stayed within and outside their target temperature ranges during one test. She planned to service any unit that did not remain within range for at least a specified minimum period. To determine whether the North Annex backup cooler required service, she first checked its within-range time. The record shows that this cooler stayed within its target range for ______
Which choice most effectively uses data from the table to complete the statement?
- A
16 hours.
- B
17 hours.
- C
21 hours.
- D
18 hours.
Show the answer
- A
16 hours.
This reads the 16-hour within-range time from the North Annex standard cooler, the row directly above the named unit.
- B
17 hours.
This uses the North Annex backup cooler’s 17-hour outside-range time instead of its within-range time.
- C
21 hours.
The 21-hour value is the greatest within-range time in the table, but it belongs to the South Annex standard cooler, not the unit named in the statement.
- D
18 hours.
Correct answerIn the North Annex backup cooler row, the entry under “Within range (hours)” is 18. Therefore, the cooler stayed within its target range for 18 hours.
Solution
Find the row labeled “North Annex backup cooler,” then read across to the “Within range (hours)” column. The value at that intersection is 18, so the statement is completed with “18 hours.”
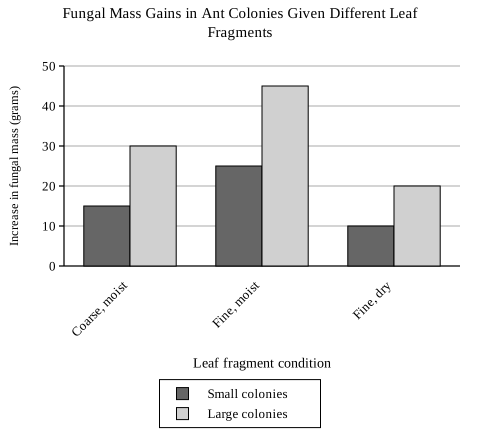
To investigate how ants farm fungus, researchers supplied small and large colonies with equal masses of leaf fragments. The fragments varied in size or moisture, while other growing conditions remained constant. After a month, the researchers measured the increase in fungal mass. They concluded that, for small colonies, finer fragments improved production when moisture was held constant, because ______
Which choice most effectively uses data from the graph to complete the statement?
- A
fungal mass increased by 30 grams with coarse, moist fragments and by 45 grams with fine, moist fragments in small colonies.
- B
fungal mass increased by 25 grams in small colonies and 45 grams in large colonies receiving the same fine, moist fragments.
- C
fungal mass increased by 15 grams with coarse, moist fragments and by 25 grams with fine, moist fragments in small colonies.
- D
small colonies gained more fungal mass with coarse, moist fragments (15 grams) than with fine, dry fragments (10 grams).
Show the answer
- A
fungal mass increased by 30 grams with coarse, moist fragments and by 45 grams with fine, moist fragments in small colonies.
The values 30 grams and 45 grams come from the large-colony series. This choice assigns those values to small colonies.
- B
fungal mass increased by 25 grams in small colonies and 45 grams in large colonies receiving the same fine, moist fragments.
This compares small and large colonies receiving fine, moist Part of a sentence written as if it were a whole one, such as a subject with no verb.Read the lesson. The conclusion requires comparing coarse and fine fragments within the small-colony series while moisture stays constant.
- C
fungal mass increased by 15 grams with coarse, moist fragments and by 25 grams with fine, moist fragments in small colonies.
Correct answerFor small colonies, fungal mass increased by 15 grams with coarse, moist Part of a sentence written as if it were a whole one, such as a subject with no verb.Read the lesson and by 25 grams with fine, moist fragments. Because both conditions used moist fragments, the 10-gram increase supports the conclusion that finer fragments improved production.
- D
small colonies gained more fungal mass with coarse, moist fragments (15 grams) than with fine, dry fragments (10 grams).
The graph does show 15 grams for coarse, moist Part of a sentence written as if it were a whole one, such as a subject with no verb.Read the lesson and 10 grams for fine, dry fragments in small colonies. However, both fragment size and moisture change, so this comparison cannot isolate the effect of fragment size.
Solution
The conclusion concerns small colonies and the effect of Part of a sentence written as if it were a whole one, such as a subject with no verb.Read the lesson size when moisture is held constant. Compare the two moist conditions in the small-colony series: fungal mass increased by 15 grams with coarse fragments and by 25 grams with fine fragments.
Changing from coarse to fine fragments while keeping them moist corresponds to an increase of grams. Therefore, the graph supports the statement that fungal mass increased by 15 grams with coarse, moist fragments and by 25 grams with fine, moist fragments in small colonies.
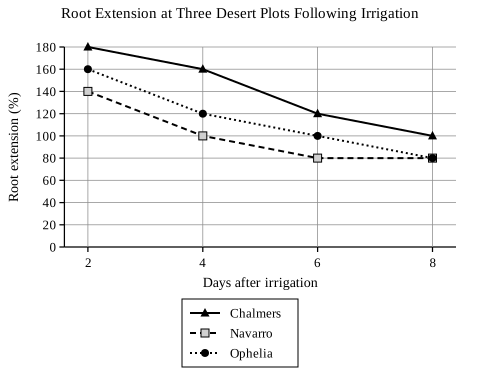
At several desert plots, botanists tracked root extension after a brief irrigation treatment (each site’s values are percentages of its own pretreatment rate). Transparent panels installed beside established shrubs allowed the team to measure new root growth without disturbing the surrounding sand. Because the shrubs belonged to the same species but occupied plots with different soil conditions, the team expected the size and duration of their responses to vary. The researchers distinguished a sharp initial response from a sustained one, since a large early increase need not persist. Nevertheless, the plot showing the largest proportional increase at the first observation also maintained enhanced growth longer than the others, as ______
Which choice most effectively uses data from the graph to complete the statement?
- A
Chalmers registered 180 percent at the first observation, and its recorded readings stayed above 100 percent through day 6, whereas both Navarro and Ophelia had reached or fallen below that level by then.
- B
Chalmers had the greatest daily root extension at every observation, whereas Navarro had the smallest amount of new root growth on day 2.
- C
Chalmers registered 180 percent at the first observation, and its rate subsequently reached 100 percent before the rates at both other plots.
- D
Chalmers showed the largest initial proportional increase, registering 180 percent while Ophelia and Navarro registered 160 and 140 percent.
Show the answer
- A
Chalmers registered 180 percent at the first observation, and its recorded readings stayed above 100 percent through day 6, whereas both Navarro and Ophelia had reached or fallen below that level by then.
Correct answerChalmers’s initial reading of 180 percent was the highest, and its readings remained above the pretreatment level of 100 percent through day 6. By day 6, Navarro was at 80 percent and Ophelia was at 100 percent, supporting both parts of the claim.
- B
Chalmers had the greatest daily root extension at every observation, whereas Navarro had the smallest amount of new root growth on day 2.
This choice treats percentages of each plot’s own pretreatment rate as absolute amounts of root growth. Without the starting rates, you cannot use these percentages to rank the plots by their amounts of new growth.
- C
Chalmers registered 180 percent at the first observation, and its rate subsequently reached 100 percent before the rates at both other plots.
The initial reading of 180 percent is accurate, but the final A stretch of words with a subject and a verb in it. Both “the road reopened” and “because the road reopened” count.Read the lesson reverses the order in which the plots reached 100 percent. Chalmers reached that level on day 8, after Navarro on day 4 and Ophelia on day 6.
- D
Chalmers showed the largest initial proportional increase, registering 180 percent while Ophelia and Navarro registered 160 and 140 percent.
The initial readings correctly establish that Chalmers had the largest proportional increase. This choice uses only the first observation, leaving out the later readings needed to show how long enhanced growth lasted.
Solution
The statement makes two claims: the plot with the largest initial proportional increase also maintained enhanced growth longest. Because each reading is a percentage of that plot’s pretreatment rate, readings above 100 percent indicate enhanced growth.
At the first observation, Chalmers registered 180 percent, exceeding Ophelia’s 160 percent and Navarro’s 140 percent. Chalmers then recorded 160 percent on day 4 and 120 percent on day 6, remaining above its pretreatment rate. Navarro had reached 100 percent by day 4, and Ophelia reached 100 percent on day 6. The completion that combines Chalmers’s highest initial reading with its readings above 100 percent through day 6 supports the full claim.
Next steps
Drills need a free account, which also saves your lesson progress on every device. Sign up free
Related lessons